Bangladesh International Flight Network
Through a wide variety of mobile applications, we’ve developed a unique visual system.
- Software ArcGIS Pro
- Date 21/05/2025
- Data Open Flights
Through a wide variety of mobile applications, we’ve developed a unique visual system.
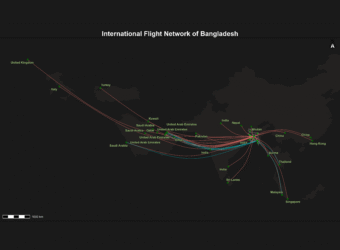
This project visualizes Bangladesh’s international flight routes on a dynamic Leaflet map using interactive, curved spatial lines and airport points. It features multi-layer map styles, smooth hover effects with detailed popups, and a legend highlighting key airports. A live flight radar widget is embedded to provide real-time air traffic data over Bangladesh, making the map informative and engaging. This tool is a powerful visualization for aviation analysis, travel planning, and geospatial storytelling.
How I built it (in a nutshell):
Install needed packages by running:
Install R and RStudio (if not installed).
install.packages(c("tidyverse", "sf", "leaflet", "htmltools", "htmlwidgets", "viridis", "geosphere"))
sf::st_read().read.csv().Country == "Bangladesh").“This Map is Built using the help of AI. Use AI if you can controll the command.”
geosphere::gcIntermediate() to create smooth curved paths between the origin and destination airports.sf spatial lines (st_linestring).htmlwidgets::onRender() to:labelOptions(sticky = TRUE) on airports to avoid flickering hover popups.leaflet::addControl() to add a bold title at the top center.leaflet::addLegend() to show color-coded BD airports with full names.htmlwidgets::saveWidget().Experiment with other airport or flight data sources.
Adjust hover sensitivity by adding invisible, thicker lines under routes.
Use sticky labels to smooth the airport name hover.
Customize colors and line styles with colorFactor() and dashArray.
Explore more Leaflet providers for different map styles.
Through a wide variety of mobile applications, we’ve developed a unique visual system.
This project presents a high-resolution soil type map of Bangladesh using FAO’s global soil dataset and the DOMSOI classification system. Developed in ArcGIS Pro, the map highlights the spatial variability of soils and supports evidence-based decision-making for sustainable agriculture, climate resilience, and environmental planning. The result is a visually compelling and data-rich tool useful for urban planners, agronomists, and GIS professionals.
How I built it (in a nutshell):
“Where data meets dirt, insights grow.”
Through a wide variety of mobile applications, we’ve developed a unique visual system.
I recently created a unique hydrological basin map of Bangladesh using ArcGIS Pro—a project that combines data precision with creative visualization. Starting with raw hydrological data (watersheds, rivers, lakes, and DEM), I processed and symbolized each layer to highlight the intricate water systems of the region. What makes this project stand out is its focus on clarity and usability, blending aesthetic design with technical accuracy. This map not only showcases Bangladesh’s hydrological features but also serves as a valuable resource for environmental planning and research. Dive into the details of how I brought this vision to life!
How I built it (in a nutshell):
1️⃣ Data Collection: Sourced global hydrology datasets (HydroSHEDS, HydroRIVERS) and a 30m-resolution Digital Elevation Model (DEM) from OpenTopography.
2️⃣ GIS Processing: Merged basin polygons, clipped DEM/river layers to Bangladesh’s extent, and classified river orders (1-6) for dynamic symbology.
3️⃣ Visualization: Applied custom glow effects for rivers, labeled key cities/lakes, and designed a sleek layout with hillshading for topographic depth.
4️⃣ Validation: Cross-referenced with satellite imagery and local hydrology reports for accuracy.
“Where Hydrology Meets Art: A Technically Robust, Visually Stunning Basin Map”
Key Insights and Outcomes for Portfolio

Through a wide variety of mobile applications, we’ve developed a unique visual system.
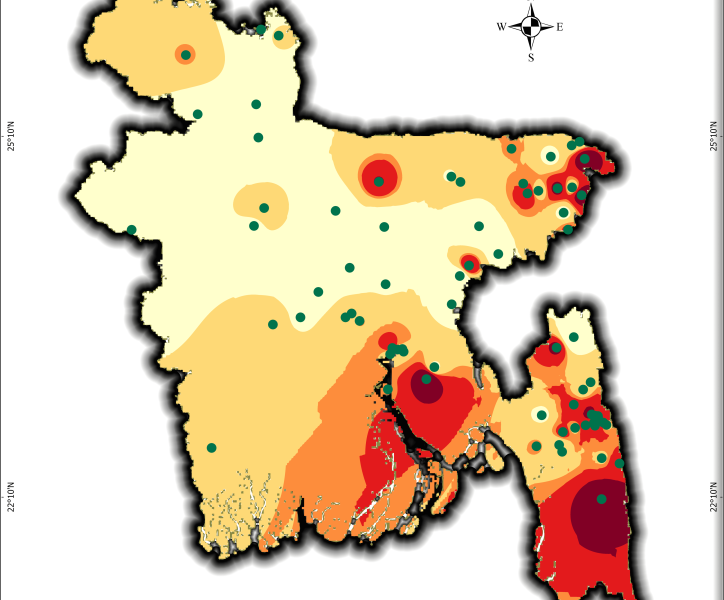
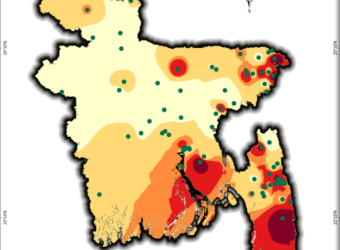
Using USGS earthquake data, I created a seismic risk map of Bangladesh, classifying zones from very low to very high risk. This helps visualize earthquake vulnerability for disaster preparedness and urban planning. A critical tool for policymakers, researchers, and communities!
What It Shows:
For high quality image visit this linkHow to Make One for Yourself:
Data Collection:

Shape file Prep:
“Mapping risks today ensures safer cities tomorrow.”
Interpolation in ArcGIS Pro:
Risk Classification:
Design & Export:
Need Help?
If you’re interested in replicating this project or need guidance for your region, feel free to reach out! I’m happy to share workflows, data sources, or troubleshoot GIS challenges. Let’s collaborate to build resilient communities. 🌍✨
Email: official.parvej.hossain@gmail.com


