Portfolio of PARVEJ Portfolio of PARVEJ
  • Home
  • Qualification
  • Project
  • Certification
  • Achievement
  • Blog
  • Shop
  • Contacts
0
Get My CV
Portfolio of PARVEJ
  • Home
  • Qualification
  • Project
  • Certification
  • Achievement
  • Blog
  • Shop
  • Contacts

Projects Category: GIS

GIS
6

Soil Type Mapping of Bangladesh

Soil Type Mapping of Bangladesh

Through a wide variety of mobile applications, we’ve developed a unique visual system.

  • Software ArcGIS Pro
  • Date 20/04/2025
  • Data FAO Soil Data
LIKE THIS 6
VIEW PROJECT

This project presents a high-resolution soil type map of Bangladesh using FAO’s global soil dataset and the DOMSOI classification system. Developed in ArcGIS Pro, the map highlights the spatial variability of soils and supports evidence-based decision-making for sustainable agriculture, climate resilience, and environmental planning. The result is a visually compelling and data-rich tool useful for urban planners, agronomists, and GIS professionals.

How I built it (in a nutshell):

🗂 Step 1: Collect Data

  • FAO Soil Data:
    • Download from FAO Soil Portal
    • Choose raster data or vector soil polygons depending on availability and classification resolution.
  • Bangladesh Administrative Boundary:
    • Source from GADM or Bangladesh Geoportal.
  • DOMSOI Classification Scheme:
    • Use documentation or tables that define soil types based on FAO soil unit codes (e.g., texture, fertility, water retention).

    🧹 Step 2: Set Up the ArcGIS Pro Project

    • Open ArcGIS Pro and create a new project.
    • Import:
      • Soil data layer (raster or vector)
      • Bangladesh boundary shapefile
    • Define a consistent Coordinate System (e.g., WGS 1984 UTM Zone 46N).

    🧭 Step 3: Clip Soil Data to Bangladesh

    • Use Geoprocessing Tools → Extract by Mask or Clip (if vector) to limit the soil dataset to the national boundary.
    • This ensures the map focuses only on Bangladesh.

    🧪 Step 4: Apply DOMSOI Soil Classification

    • Add a new field to the soil layer for DOMSOI classification.
    • Use Field Calculator or Join Tables (based on FAO soil unit code) to assign DOMSOI categories.
    • Optionally, use Symbology → Unique Values to visualize different soil types with distinct colors.

    🗺 Step 5: Style the Map

    • Add:
      • Base Map (e.g., Topographic or Terrain)
      • Labels for administrative boundaries
      • Legend, North Arrow, Scale Bar
    • Use Layout View to create a printable or exportable map layout.

    📤 Step 6: Export the Map

    • Export to:
      • High-Resolution PNG/JPEG via Share → Export Layout
      • PDF for reports and presentations
    • Upload image to cloud hosting (e.g., jmp.sh) for easy sharing.

    “Where data meets dirt, insights grow.”

    GIS

    Bangladesh’s Hydrological Basin Map

    Bangladesh’s Hydrological Basin Map

    Through a wide variety of mobile applications, we’ve developed a unique visual system.

    • Software ArcGIS Pro
    • Date 13/02/2025
    • Category GIS
    LIKE THIS 0
    VIEW PROJECT

    I recently created a unique hydrological basin map of Bangladesh using ArcGIS Pro—a project that combines data precision with creative visualization. Starting with raw hydrological data (watersheds, rivers, lakes, and DEM), I processed and symbolized each layer to highlight the intricate water systems of the region. What makes this project stand out is its focus on clarity and usability, blending aesthetic design with technical accuracy. This map not only showcases Bangladesh’s hydrological features but also serves as a valuable resource for environmental planning and research. Dive into the details of how I brought this vision to life!

    How I built it (in a nutshell):

    1️⃣ Data Collection: Sourced global hydrology datasets (HydroSHEDS, HydroRIVERS) and a 30m-resolution Digital Elevation Model (DEM) from OpenTopography.

    2️⃣ GIS Processing: Merged basin polygons, clipped DEM/river layers to Bangladesh’s extent, and classified river orders (1-6) for dynamic symbology.

    3️⃣ Visualization: Applied custom glow effects for rivers, labeled key cities/lakes, and designed a sleek layout with hillshading for topographic depth.

    4️⃣ Validation: Cross-referenced with satellite imagery and local hydrology reports for accuracy.

    “Where Hydrology Meets Art: A Technically Robust, Visually Stunning Basin Map”

    Key Insights and Outcomes for Portfolio

    1. Data Integration: Successfully combined multiple datasets, including watersheds, rivers, lakes, and DEM, to create a comprehensive hydrological map.
    2. Technical Expertise: Utilized advanced tools in ArcGIS Pro, such as clipping, hillshade generation, and layer symbology, to enhance map accuracy and aesthetics.
    3. Unique Contribution: Highlighted Bangladesh’s hydrological basins in a way that balances technical detail with visual appeal, making it accessible for both experts and non-experts.
    4. Practical Applications: The map can be used for environmental studies, flood risk assessments, and sustainable water resource management.
    5. Creative Symbolization: Employed innovative labeling and styling techniques to ensure clarity and readability, setting this project apart from standard hydrological maps.
    GIS
    7

    Mapping Bangladesh’s Seismic Risks

    Mapping Bangladesh’s Seismic Risks

    Through a wide variety of mobile applications, we’ve developed a unique visual system.

    • Software ArcGIS Pro
    • Timeframe 2001-2025
    • Data USGS
    • Study Area Bangladesh
    LIKE THIS 7
    VIEW PROJECT

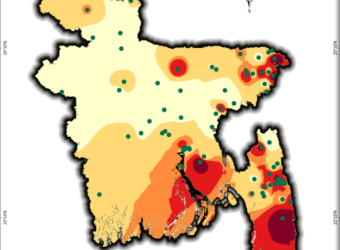
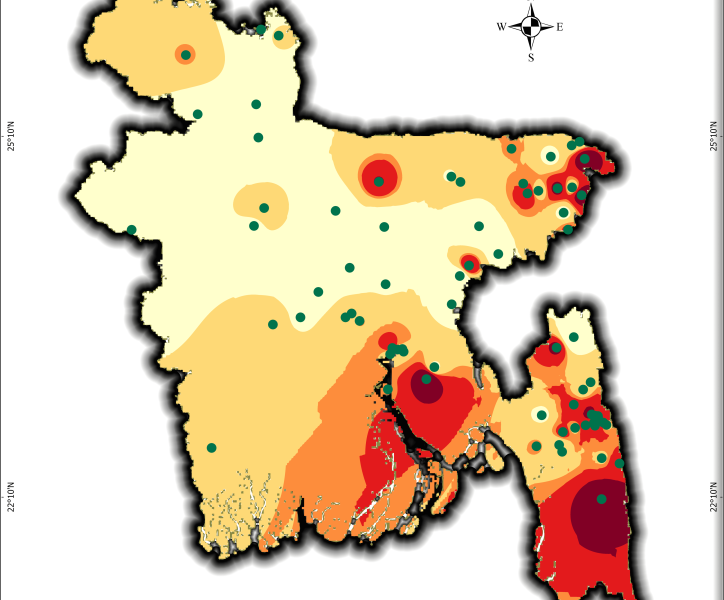
    Using USGS earthquake data, I created a seismic risk map of Bangladesh, classifying zones from very low to very high risk. This helps visualize earthquake vulnerability for disaster preparedness and urban planning. A critical tool for policymakers, researchers, and communities!

    What It Shows:

    • Data Span: Earthquake occurrences from 2001–2025 (magnitude, location).
    • Risk Zones: 5-tier classification (very low to very high ) based on interpolated seismic activity.
    For high quality image visit this link

    How to Make One for Yourself:

    Data Collection:

    • Download earthquake data (2001–2025) from USGS Earthquake Catalog.
    • For download Bangladesh data, use Geographic region as custom and give the North, South, East, West location in the box.
    • Then download the data in CSV format.

    Shape file Prep:

    • Get Bangladesh’s administrative boundary shape file from GADM or DIVA-GIS or Hum data website.
    • Then add the csv to ArcGIS and show it as xy table to point, select the magnitude field as Z field and longitude as x, latitude as x.
    • Then export this feature as a shape file.
    • Then clip the earthquake shape file based on BD administrative boundary.

    “Mapping risks today ensures safer cities tomorrow.”

    Interpolation in ArcGIS Pro:

    • Use Kernel Density or IDW tools to map seismic intensity.
    • For IDW spatial analyst tool, select the earthquake shape file as input point feature , select magnitude field as Z field value.
    • Give an output name and location and in the Environments tab select coordinate system as wgs1984.
    • Select the Extent and Mask in Raster Analysis as BD shape file.

    Risk Classification:

    • Reclassify the interpolated raster into 5 zones using Equal Intervals or Natural Breaks from the symbology pan of the IDW.
    • Then change the color as you like.

    Design & Export:

    • Add legends, scale bars, and labels. Use color ramps (e.g., green → red) for clarity.
    • Export as PDF/high-res image for sharing.

    Need Help?
    If you’re interested in replicating this project or need guidance for your region, feel free to reach out! I’m happy to share workflows, data sources, or troubleshoot GIS challenges. Let’s collaborate to build resilient communities. 🌍✨

    Email: official.parvej.hossain@gmail.com

    Recent Posts

    • Learn R – Part 4
    • Learn R – Part 3
    • Learn R – Part 2
    • Learn R – Part 1
    • Course Review: How to Write and Publish a Scientific Paper

    Recent Comments

    No comments to show.

    Archives

    • April 2025
    • March 2025

    Categories

    • Course Review
    • R Language

    Featured posts

    Learn R – Part 4
    • 11/04/2025
    • 5 min read
    Learn R – Part 3
    • 08/04/2025
    • 4 min read
    Learn R – Part 2
    • 06/04/2025
    • 4 min read

    Categories

    • Course Review
    • R Language

    Find Me