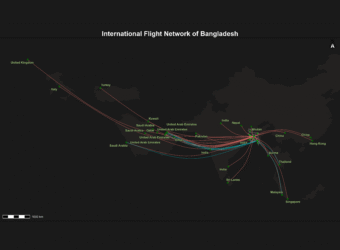
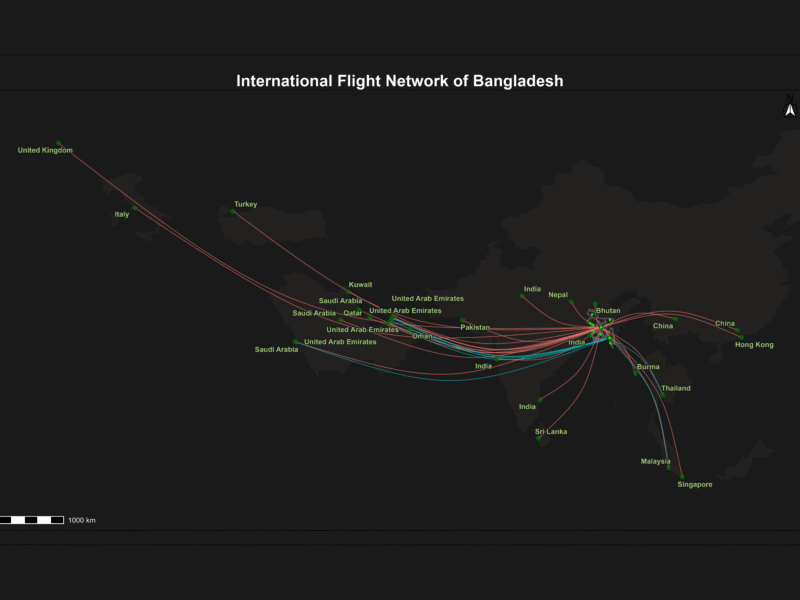
This project visualizes Bangladesh’s international flight routes on a dynamic Leaflet map using interactive, curved spatial lines and airport points. It features multi-layer map styles, smooth hover effects with detailed popups, and a legend highlighting key airports. A live flight radar widget is embedded to provide real-time air traffic data over Bangladesh, making the map informative and engaging. This tool is a powerful visualization for aviation analysis, travel planning, and geospatial storytelling.
How I built it (in a nutshell):
1. Set Up Your Environment
Install needed packages by running:
Install R and RStudio (if not installed).
R install.packages ( c ( " tidyverse " , " sf " , " leaflet " , " htmltools " , " htmlwidgets " , " viridis " , " geosphere " )) 2. Prepare Your Data
Download the shapefile for Bangladesh administrative boundaries.
Download airport and route data (e.g., from OpenFlights: airports.dat, routes.dat).
Read the shapefile with sf::st_read().
Load airports and routes as CSV using. read.csv().
3. Filter and Clean Data
Filter airports for Bangladesh only (Country == "Bangladesh").
Select international routes starting from BD airports and going outside airports with no stops.
Join the airport info to the routes for coordinates.
“This Map is Built using the help of AI. Use AI if you can controll the command.”
4. Create Curved Flight Lines
Use geosphere::gcIntermediate() to create smooth curved paths between the origin and destination airports.
Convert these to sf spatial lines (st_linestring).
5. Build Your Leaflet Map
Initialize leaflet with desired base maps (e.g., CartoDB.DarkMatter, Esri.WorldImagery).
Add the Bangladesh polygon shapefile with a semi-transparent fill.
Add curved flight lines with color coding by source airport, dashed lines, and pop-up info.
Add airport points (circles) with hover tooltips using sticky labels.
Use invisible, thicker lines under flight routes to improve hover sensitivity.
6. Add Interactivity
Add JavaScript event handlers via htmlwidgets::onRender() to:
Highlight flight lines on hover with a thicker blue dashed style.
Show/hide popups smoothly.
Use sticky labelOptions(sticky = TRUE) on airports to avoid flickering hover popups.
7. Add Title and Legend
Use leaflet::addControl() to add a bold title at the top center.
Use leaflet::addLegend() to show color-coded BD airports with full names.
8. Embed Live Flight Radar Map
Embed an iframe from a flight radar website (like AirNavRadar) in a Leaflet control at the bottom left.
Resize iframe (e.g., 350×270 px) to fit nicely inside the map.
Style iframe container with border and rounded corners.
9. Save and Share
Save your map as a self-contained HTML file using. htmlwidgets::saveWidget().
Open in any browser to explore and share.
10. Tips for Improvement
Experiment with other airport or flight data sources.
Adjust hover sensitivity by adding invisible, thicker lines under routes.
Use sticky labels to smooth the airport name hover.
Customize colors and line styles with colorFactor() and dashArray.
Explore more Leaflet providers for different map styles.