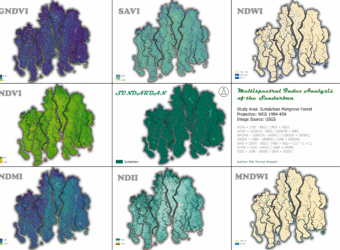

Multi-Spectral Index Analysis of the Sundarban Mangrove Forest
- Software ArcGIS Pro
- Date 21/08/2025
- Category Remote Sensing
Here’s an analysis of the Sundarban Mangrove Forest using various multi-spectral indices derived from satellite imagery. These indices are powerful tools for monitoring the health of vegetation, water bodies, and soil.
Why This Analysis Matters 💡
Monitor vegetation health: NDVI, GNDVI, and SAVI help track the vitality of mangrove trees, indicating areas of stress or degradation. Map water resources: NDWI and MNDWI are essential for mapping the complex network of rivers and channels, which is vital for understanding the hydrology of this dynamic estuarine system. Assess moisture content: NDMI and NDII provide insight into the moisture levels of soil and vegetation, which is crucial for a forest that depends on a specific salinity balance.
Map water resources: NDWI and MNDWI are crucial for mapping the intricate network of rivers and channels, essential for understanding the hydrology of this dynamic estuarine system.
Assess moisture content: NDMI and NDII provide insight into the moisture levels of both the soil and vegetation, which is vital for a forest that relies on a specific salinity balance.
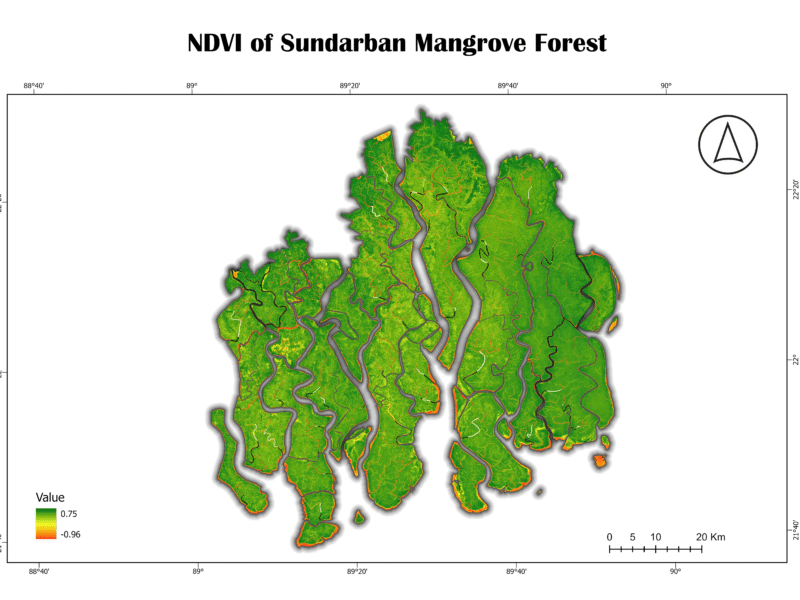
The NDVI is a widely used vegetation index that measures the difference between near-infrared (NIR) and red light reflected by vegetation. Healthy plants absorb red light for photosynthesis and reflect high amounts of NIR light, resulting in a high NDVI value. Unhealthy or sparse vegetation, as well as non-vegetated areas like water or soil, have much lower values.
NDVI=(NIR-RED)/(NIR+RED)

Importance:
NDVI is crucial for assessing vegetation health, density, and biomass. It’s a key tool for monitoring agricultural fields, assessing forest health, and tracking seasonal changes in vegetation. Its simplicity and effectiveness have made it a cornerstone of remote sensing applications.
Analysis of Sundarban Data:
The NDVI map for the Sundarban shows a significant majority of the area in shades of green, indicating a high density of healthy vegetation. The highest values (bright green) are found in the core, densely forested areas. The lower values (yellow and orange) are concentrated along the riverbanks and coastal fringes, suggesting either sparse vegetation or the presence of a mix of land and water. The very low values (darker shades) correspond to open water bodies. The overall high NDVI values confirm that the Sundarban remains a remarkably healthy and dense forest ecosystem.
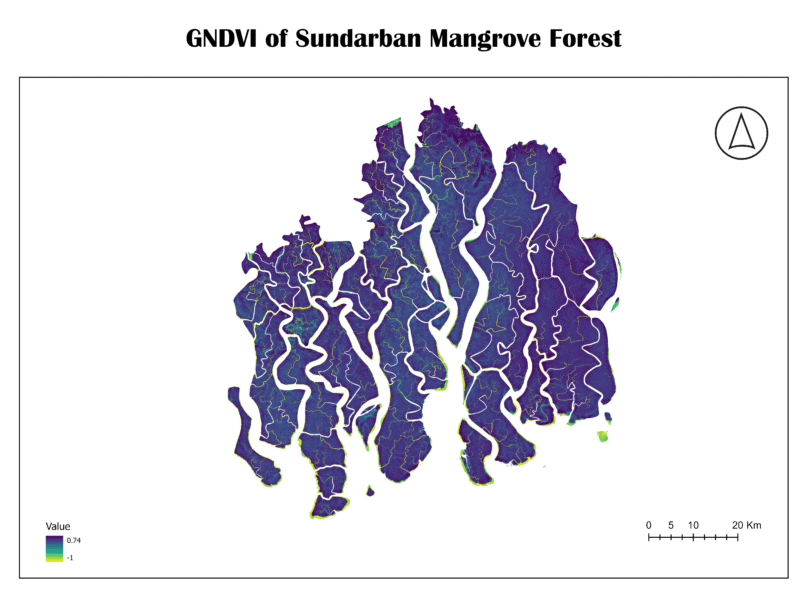
2. Green Normalized Difference Vegetation Index (GNDVI)
The GNDVI is a vegetation index similar to NDVI, but it uses the green band instead of the red band. This index is particularly sensitive to chlorophyll content in leaves, making it a better indicator of vegetation stress, especially in crops or when analyzing a wider range of chlorophyll concentrations.
NDVI=(NIR-GREEN)/(NIR+GREEN)

Importance:
GNDVI is valuable for detecting early signs of plant stress, which may not be visible in NDVI. It is also less prone to saturation than NDVI in areas of high biomass, making it helpful in monitoring very dense forests.
Analysis of Sundarban Data:
The GNDVI map of the Sundarban is characterized by deep blue and purple hues, with a few pockets of light green and yellow. This color scheme suggests that while the vegetation is healthy, there’s a wide range of chlorophyll content. The very high values (light green/yellow) might indicate areas with particularly high leaf chlorophyll, while the darker blue areas show healthy vegetation with standard chlorophyll levels. The patterns are very similar to the NDVI map, confirming the overall health of the forest.
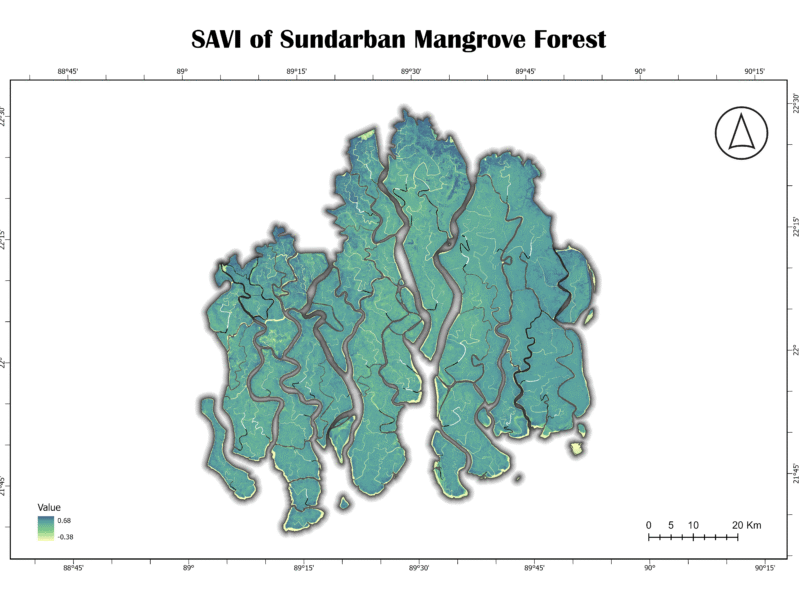
3. Soil-Adjusted Vegetation Index (SAVI)
The SAVI is an enhanced vegetation index designed to minimize the influence of soil brightness on the vegetation signal. It incorporates a soil-adjustment factor, “L,” which accounts for variations in soil background. This makes it more reliable than NDVI in areas with low vegetation cover or exposed soil.
SAVI = ((NIR – RED) × (1 + L)) / (NIR + RED + L)

L is a soil-adjustment factor, typically set to 0.5 for most landscapes.
Importance:
SAVI is critical for accurate vegetation mapping in semi-arid regions or areas with sparse vegetation, where the reflected signal from the soil can interfere with the vegetation index. It helps to distinguish between actual vegetation and background soil noise.
Analysis of Sundarban Data:
The SAVI map of the Sundarban exhibits a visual pattern very similar to the NDVI map, with healthy vegetation represented by shades of teal and green. This similarity suggests that soil background has a minimal effect on the vegetation signal in this dense, canopied forest. This is expected, as the mangrove forest floor is often covered by water or is a dense root network, minimizing exposed soil. The highest values correspond to dense vegetation, while lower values are found in waterways and coastal areas.
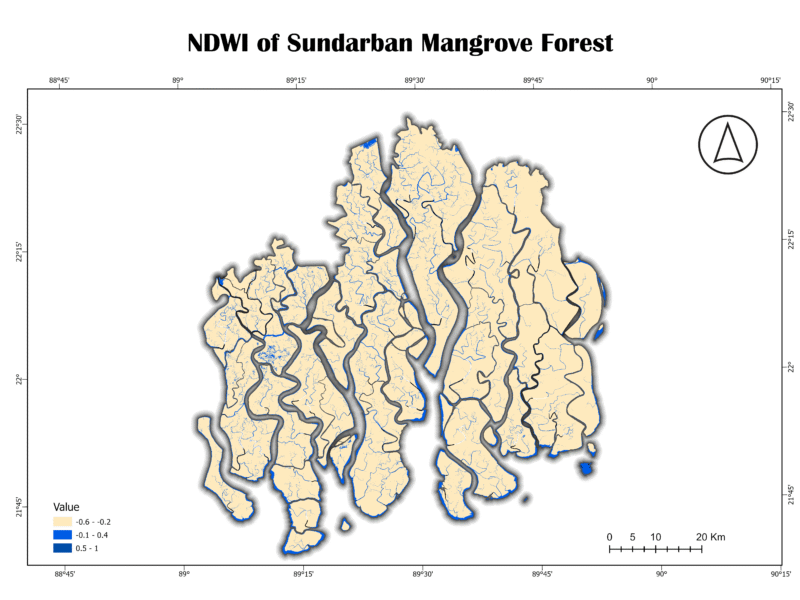
4. Normalized Difference Water Index (NDWI)
The NDWI is an index that uses the green and near-infrared bands to highlight liquid water and moisture content. It’s particularly effective for mapping surface water bodies like lakes, rivers, and coastal waters. Water bodies typically have a high positive NDWI value, while vegetation and soil have much lower or negative values.
NDWI = (GREEN – NIR) / (GREEN + NIR)

Importance:
NDWI is vital for monitoring changes in surface water extent, which is critical for flood mapping, drought monitoring, and managing water resources. In a coastal system like the Sundarban, it’s essential for mapping the extensive tidal creeks and channels.
Analysis of Sundarban Data:
The NDWI map of the Sundarban clearly delineates the vast and complex network of waterways. The light blue shades represent the open water bodies, while the beige and gray areas correspond to land. The sharp contrast between land and water demonstrates the index’s effectiveness in this environment. The numerous small, interconnected channels are visible, highlighting the forest’s unique hydrology.
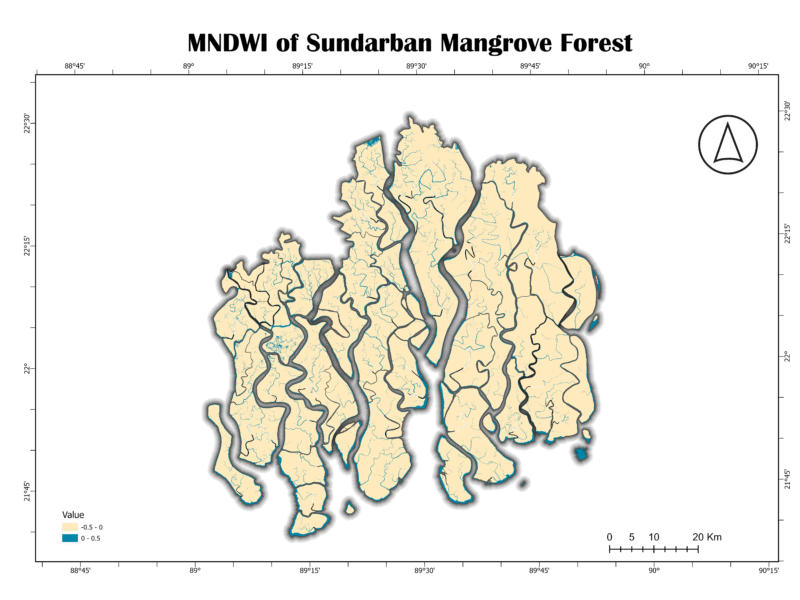
5. Modified Normalized Difference Water Index (MNDWI)
The MNDWI is an improved version of the NDWI. It replaces the NIR band with the short-wave infrared (SWIR) band, which provides better performance in discriminating water from vegetation and soil. MNDWI is more effective at suppressing noise from urban features and soil background, leading to a more precise delineation of water bodies.
MNDWI = (GREEN – SWIR) / (GREEN + SWIR)

Importance:
MNDWI is superior to NDWI for mapping water bodies in areas with high vegetation cover or where urban features are present. Its improved accuracy makes it a preferred choice for detailed hydrological mapping.
Analysis of Sundarban Data:
The MNDWI map for the Sundarban shows a very clear and precise representation of the waterways. Similar to NDWI, the light blue shades highlight the water. However, the land areas appear more uniform in color, suggesting that MNDWI effectively removes vegetation and other noise, providing a cleaner water mask. This is a valuable asset for studying the intricate tidal channels without interference from the dense mangrove canopy.
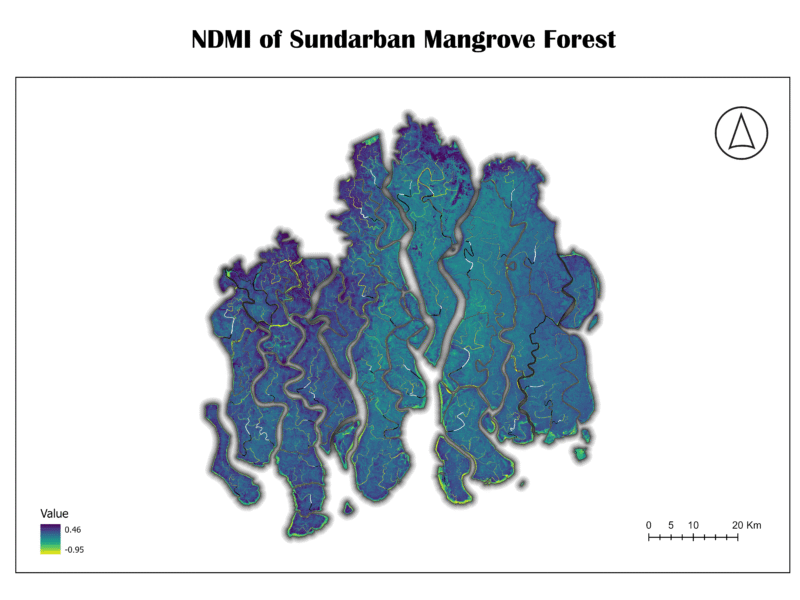
6. Normalized Difference Moisture Index (NDMI)
The NDMI, also known as the Land Surface Water Index (LSWI), measures the water content of vegetation and soil. It uses the NIR and SWIR bands. High NDMI values indicate high moisture content, while low values suggest dryness or areas with low water content.
NDMI = (NIR – SWIR) / (NIR + SWIR)

Importance:
NDMI is crucial for drought monitoring, assessing fire risk, and evaluating the health of wetlands and other moisture-dependent ecosystems. In a mangrove forest, it is vital to understand the balance of water and vegetation.
Analysis of Sundarban Data:
The NDMI map of the Sundarban shows high moisture levels, as expected for a tidal forest. The dark blue and green shades across the majority of the land area confirm that the vegetation and soil are saturated with water. The low values (yellow) are present along some of the coastal fringes, which might indicate areas with higher salinity or less dense vegetation. This map confirms that the Sundarban’s hydrology maintains the necessary moisture for the ecosystem’s survival.
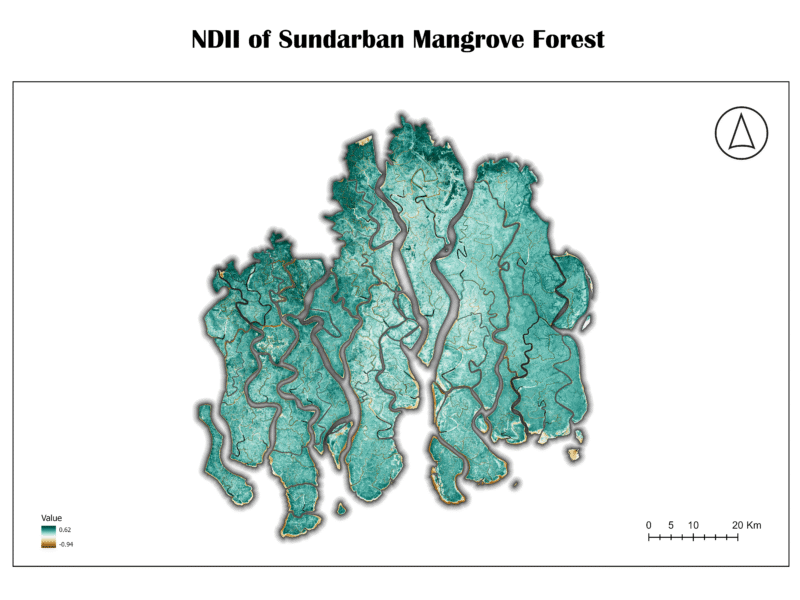
7. Normalized Difference Infrared Index (NDII)
The NDII is another index sensitive to vegetation and soil moisture. It is structurally identical to NDMI, using the NIR and SWIR bands. The two terms are often used interchangeably in scientific literature, as they both measure the same biophysical characteristic.
NDII = (NIR – SWIR) / (NIR + SWIR)

Importance:
Like NDMI, NDII is essential for monitoring water stress in vegetation and assessing the overall moisture status of an ecosystem. Its use is critical for tracking changes in water availability and its impact on plant health.
Analysis of Sundarban Data:
The NDII map of the Sundarban shows a similar pattern to the NDMI map, with the majority of the forest area displaying high values (dark blue and green), confirming a high degree of moisture content. This redundancy in results from both NDMI and NDII strengthens the conclusion that the Sundarban is a well-hydrated ecosystem.
Conclusion
This multi-spectral index analysis of the Sundarban Mangrove Forest provides a comprehensive and detailed snapshot of the ecosystem’s current health. The maps successfully delineate key components: healthy vegetation, intricate waterways, and overall moisture content. The high values for NDVI, GNDVI, NDMI, and NDII confirm the vitality of the forest, while the clear delineation of water bodies by NDWI and MNDWI highlights the importance of the river network.
This project is an excellent example of how remote sensing can be used to monitor and manage critical ecosystems. The data serves as a valuable baseline for future studies on climate change impacts, sea-level rise, and conservation efforts. It demonstrates the power of geospatial technology in p
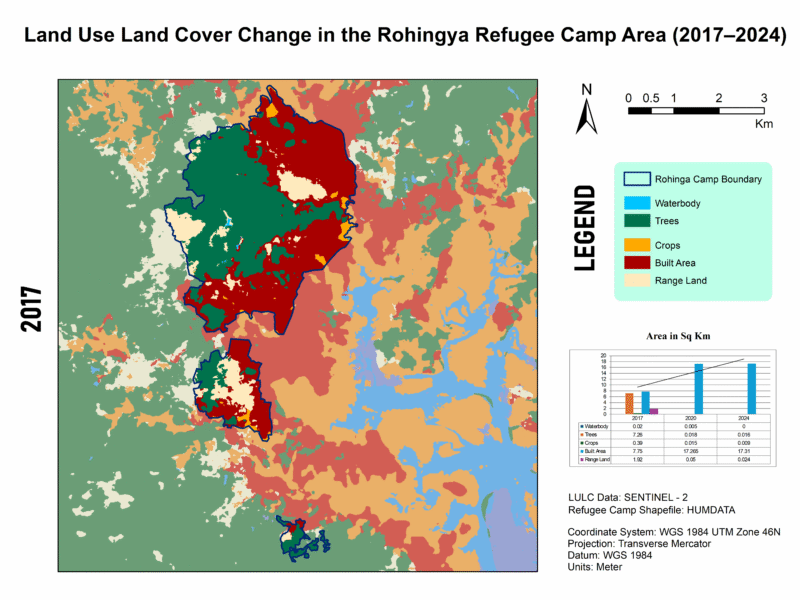
This series illustrates land use and land cover (LULC) shifts across three key years—2017, 2020, and 2024—highlighting dramatic environmental changes in response to Rohingya settlement. Between 2017 and 2024, built-up areas surged from 7.75 km² to 17.31 km², while tree cover plummeted from 7.26 km² to just 0.016 km², indicating large-scale deforestation—trends confirmed by satellite-based studies showing up to 74% forest loss from 2015–2021 and over 3,200 ha cleared by 2024.
What It Shows:

For high quality image visit this link🖼️ Map 1: 2017 LULC Baseline
Description: The map reveals a relatively modest built-up footprint (7.75 km²) and robust tree cover (7.26 km²), set against 1.92 km² of rangeland and small waterbodies. This pre-expansion snapshot reflects early stages following the 2017 refugee influx, with natural forest still dominant and human infrastructure beginning to take hold.
📍 Qualitative Insight: The area had yet to experience significant land clearance—UN data indicates ~1,219–1,313 ha were cleared by early 2018.

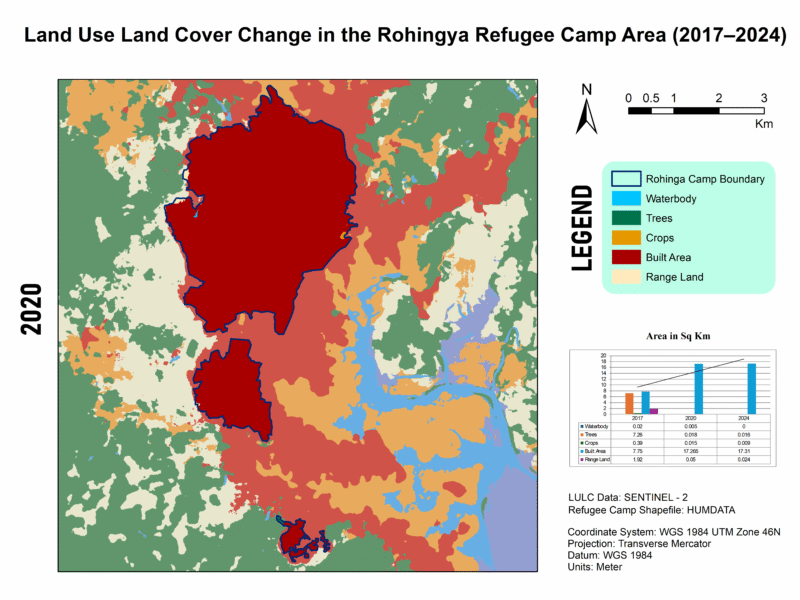
For high quality image visit this link🖼️ Map 2: 2020 LULC – Peak Transformation
Description: By 2020, built-up area had more than doubled (17.27 km²) while tree and crop cover collapsed to near-zero levels. Waterbodies shrank to only 0.005 km², rangeland nearly vanishing (0.05 km²).
📍 Quantitative Insight: In just three years, settlements expanded roughly tenfold, echoing reports of ~71% forest loss from 2015–2018 and dramatic wetland increases, though only until 2018, matching observed exponential LULC shifts.

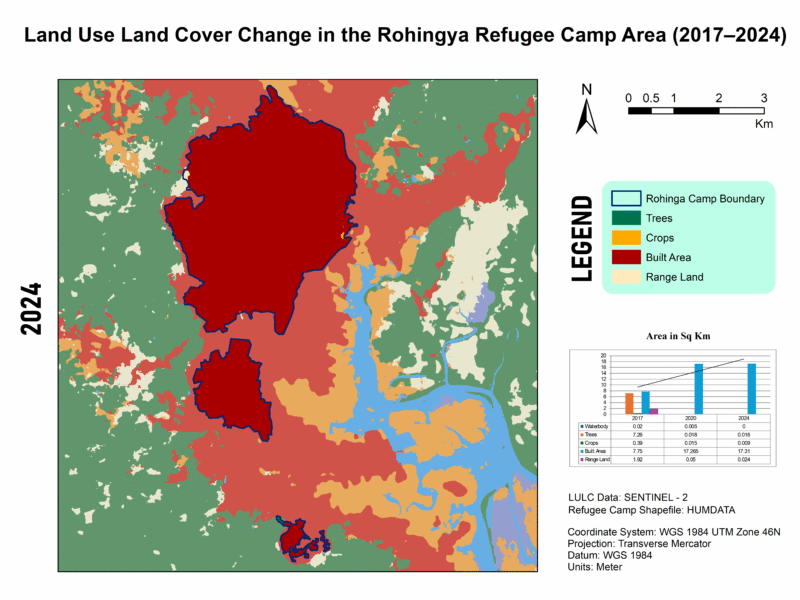
For high quality image visit this link🖼️ Map 3: 2024 LULC – Stabilization or Continuing Loss?
Description: The latest map shows built-up area plateauing (~17.31 km²), but vegetation remains decimated (trees: 0.016 km²; crops: 0.009 km²), and open rangeland is minimal (0.024 km²). Waterbodies are effectively gone.
📍 Contextual Insight: This aligns with findings of ~3,200 ha of forest clearance by 2024 and ongoing rehabilitation efforts on degraded lands, though full ecological recovery has yet to materialize.
📊 Integrating My Data (2017–2024)
| Year | Waterbodies | Trees | Crops | Built-up | Rangeland |
|---|---|---|---|---|---|
| 2017 | 0.02 km² | 7.26 km² | 0.39 km² | 7.75 km² | 1.92 km² |
| 2020 | 0.005 km² | 0.018 km² | 0.015 km² | 17.27 km² | 0.05 km² |
| 2024 | 0 km² | 0.016 km² | 0.009 km² | 17.31 km² | 0.024 km² |
These figures demonstrate dramatic deforestation and urban expansion up to 2020, with built-up area stabilizing thereafter—likely due to space saturation—while natural land cover remains critically low.
Between 2017 and 2024, the rapid influx of Rohingya refugees into Cox’s Bazar has devastated the region’s natural environment. Approximately 8,000 acres of forest—around 6,164 acres inside camp boundaries and another 1,837 acres around—were cleared, primarily for shelter construction and firewood rsisinternational.org+7pmc.ncbi.nlm.nih.gov+7aljazeera.com+7rsisinternational.org+2en.wikipedia.org+2undrr.org+2. This large-scale deforestation extended over 26,600 hectares of forest in surrounding Ukhia, Whykong, and Teknaf ranges, impacting critical biodiversity zones like Teknaf Wildlife Sanctuary, Inani, and Himchhari National Parks, and pushing wildlife, including endangered Asian elephants, into closer and often dangerous proximity with humans. Removal of vegetation and hill cutting—50% of which was observed in some spots—has severely destabilized slopes, triggering widespread soil erosion, frequent landslides, flash floods, and even hill collapses during the monsoon reddit.com. The disappearance of groundcover further increased surface heat and disrupted natural water retention, leading to rising land surface temperatures (~+7–8 °C) and reduced groundwater levels due to excessive tube-well use reddit.com+10mdpi.com+10icccad.net+10. This has led to a cascade of adverse effects: habitat fragmentation, human–wildlife conflicts, heightened flood risk, pollution of water sources, and loss of ecosystem services, including biodiversity, carbon storage, and soil fertility rsisinternational.org. While some mitigation efforts—such as vetiver grass planting and reforestation programs by IOM, FAO, and UN agencies—have begun to stabilize slopes and reduce landslide incidents, the scale of ecological damage remains vast and long-term resilience demands sustained restoration and strategic land-use planning iom.int+1undrr.org+1.
Need Help?
If you’re interested in replicating this project or need guidance for your region, feel free to reach out! I’m happy to share workflows, data sources, or troubleshoot GIS challenges. Let’s collaborate to build resilient communities. 🌍✨
Email: official.parvej.hossain@gmail.com