Description
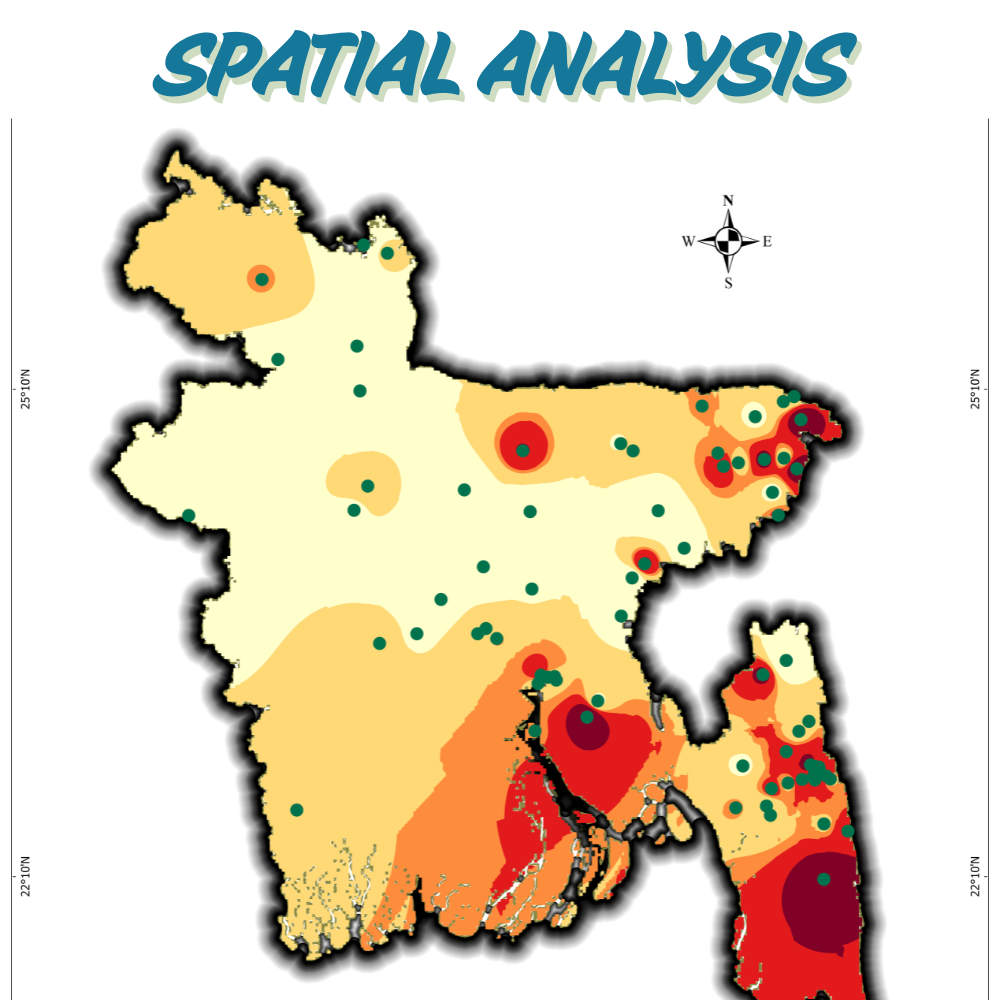
“Identify statistically significant hotspots (crime, disease, retail trends) using ArcGIS, QGIS, or R. Get heatmaps, cluster reports, and actionable insights for data-driven decisions. Ideal for public health agencies, urban planners, and market researchers.”
Required Files :
Upload point/polygon data (formats: CSV, Shapefile, KML, Excel).
Example: Crime incident coordinates, disease case locations, or retail store footfall data.
Specify Details :
Analysis goal : e.g., “Identify burglary hotspots” or “Track malaria outbreak clusters.”
Geographic scope : City name, region, or upload a boundary file (Shapefile/KML).
Statistical method : Choose Kernel Density, Getis-Ord Gi*, or let us recommend.
Timeframe : Include dates if analyzing temporal trends.
Optional Add-ons : Add a note if you need integration with demographic or satellite data.
PS :
- File Size Limits : Compress large files into ZIP/RAR folders before upload.
- Confidential Data : Add a note if files contain sensitive information for secure handling.
Reviews
There are no reviews yet.